LEA Low Contrast
Grating Acuity Test
#253400
In this test there are for each contrast level two different gratings (Figure 1) so that threshold values can be measured at distances that are possible in usual examination rooms and within the visual sphere of most children and adults. This test makes it possible to measure contrast sensitivity with a test that you can carry with you instead of being dependent on computer based tests. They often have too small stimuli, which result in too low values. Please read about the relationship between the size of the stimulus and the contrast sensitivity value in the Introduction.

Figure 1. LEA Low Contrast Grating Acuity Test measures contrast sensitivity at 3 contrast levels, 10%, 2.5%, and 1.2% contrast using 3 grating frequencies: 0.5 cpcm and 8 cpcm gratings at 10% contrast and 0.5 cpcm and 4 cpcm gratings at 2.5% and 1.2% contrast.
When assessing vision of a child or an adult, it is important to know that some individuals perceive the central parts of gratings as irregular patterns and not as straight lines and, therefore, cannot define the orientation of the lines except at the edges. It is also possible that the person does not perceive the finer gratings at all, which is rare but will be found in individuals with brain lesions and in amblyopic eyes. Therefore, it is wise to demonstrate the gratings by showing the 0.5 cpcm and 8 cpcm gratings at 10% contrast and the 4 cpcm grating at 2.5% contrast at the distance of 60cm (2 feet) when beginning the test, asking how the child or adult sees the gratings.
A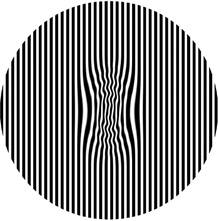
 B
B
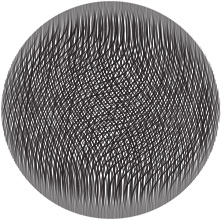
Figure 2. The distorted lines are difficult to describe. Adult persons can show where on the test they see the lines as straight lines. A. The disturbance can also be seen in the broad lines that may bend toward each other when there is a central scotoma. B. The most common finding is distortion in the 8 cpcm grating, which may be an irregular net or totally invisible as lines but a grey surface. If a child does not know how to describe the lines ask the child to move his finger along the lines, first the broad lines and then the narrower and narrower lines to observe how the movement of the finger depicts the lines.
If the person answers that “the broad lines are rather regular straight lines but the other ones are not, and they wiggle”, then you have made an important observation at the beginning of the test and know that the definition of the direction of the grating lines might be difficult to the child/adult. Therefore you should remember to ask at each threshold whether the lines are seen straight also in the centre of the grating. If the lines are straight only at the edges the corresponding test distance is recorded, after which you move closer until the lines become straight also in the centre of the test. This way you collect important information about the structure of the image, information that is lost if only the resolving of the direction of the lines (somewhere in the image) is used as the threshold.
Instructions
If the child/adult has difficulties perceiving the 8 cpcm gratings at 10% as straight lines at 57 cm and until 30 cm, use the 10% 0.5 cpcm test at 2.3 m to 4.6 m (if within the child’s visual sphere). At these distances its cpd value varies between 2 cpd and 4cpd so it can be used to replace the 8 cpcm test. At these distances the size of the test varies between 4.5 and 2.2 degrees, i.e. the values depict the function of the central visual field at and around the fixation area only.
The exact values you find in the nomograms in Figure 2. The distances in the nomograms are given until 3.4 m because longer test distances than 3 m are seldom used.
- The measurement is easiest if you have a tape measure taped on the floor and you walk along it. Then you can check the distance every time when the person/child correctly reports the orientation of the lines.
- Children may need to train to show the orientation of lines with their hand or using the keycard-grating. If a child’s responses are irregular, it is possible that near the threshold the child perceives the lines moving and thus their orientation is difficult to define.
- Based on your observations during the demonstration of the gratings, choose the first test grating so that it is seen at a distance longer than 120 cm (4’) if the distance is within the visual and cognitive sphere of the child/adult person.
- Move the test grating to a distance where the child/person can no longer discriminate the direction/orientation of the grating lines. When testing a child, say something like “Now I walk a bit farther until you no longer see the lines. Do you see them now? No, then we can start”.
- Bring the grating slowly closer to the child/person until he can perceive the orientation of the grating.
- Use the 4 different orientations when defining the threshold distance. To show the grating in the next orientation, turn the evenly grey surface toward the subject and then turn the grating to a new orientation. When you show the grating, avoid turning it. Ask the child/person to respond by showing the orientation of the lines with his hand or with the keycard grating. Some children can use only horizontal and vertical orientations, which makes the definition of the threshold very difficult.
- The direction of the lines should be varied randomly. However, it is wise not to show the same direction a second time immediately after the first presentation or to show the lines in a direction that the person has just used in his (wrong) answer because people tend not to repeat an answer. Therefore, the use of two presentations of the same orientation of the lines is likely to lead to a wrong answer during the second presentation.
- The threshold distance is defined when at least three out of five presentations lead to the correct response at that distance. Children may not tolerate five measurements, so we often have to be happy with 2 to 3 answers at threshold, especially if they are at nearly the same distance.
- Record the threshold distance and the grating used.
The grating acuity value as cycles per degree (cpd) that corresponds to the distance of the threshold measurement is read on the nomogram that corresponds the grating used (Figure 3, Nomogram A, B or C).
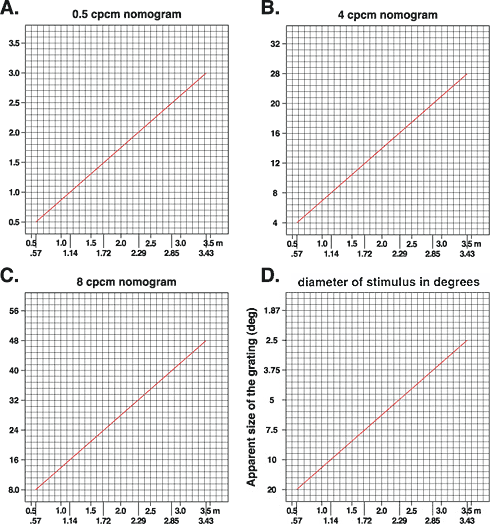
Figure 3. Nomogram I. Grating acuity (cpd) as a function of testing distance. A. 0.5 cpcm grating, B. 4.0 cpcm grating, and C. 8.0 cpcm grating. D. The size of the stimulus at different distances.
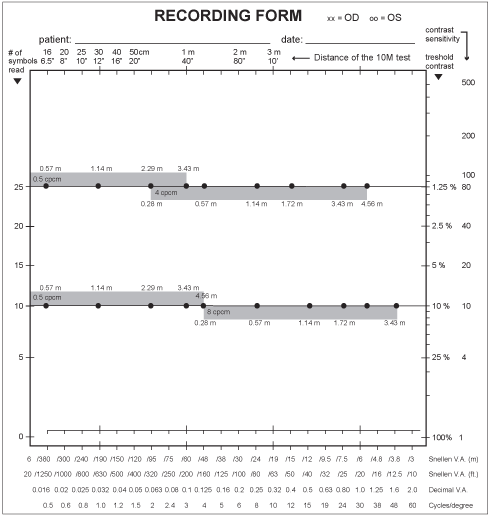
Figure 4. For the measurements of the grating acuity at each contrast level there are two gratings. At the 10% contrast level, the gratings are 0.5 cpcm and 8 cpcm. At the 2.5% and 1.2% contrast levels, the gratings are 0.5 cpcm and 4 cpcm. At the 2.5% and 1.2% contrast levels, the distances are the same and marked at the 1.2% level.
On the Recording Form in Figure 4, the distances are marked where each grating gets a certain cycle-per-degree value (cpd). Because the threshold is seldom exactly at these distances, the nomograms in Figure 3 A, B, and C give the cpd values of each grating at different distances. The nomogram D depicts the grating size in degrees of visual angle at the distance used.
For example, if a person saw the 4 cpcm grating at 1.15 m distance, grating acuity is 8 cpd with a 10 degree stimulus: [4 cpcm corresponds to 4 cpd at 57 cm and 8 cpd at 115 cm (≈2x57 cm). Because the grating is 20 cm in diameter, it is 20 degrees at 57 cm and 10 degrees at 115 cm distance. The size of the stimulus can be read from the nomogram D.]
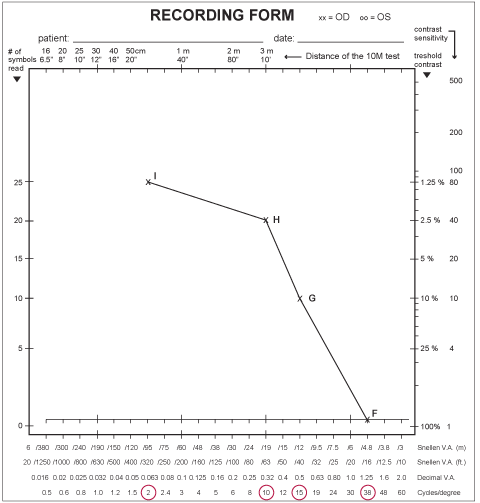
Figure 5. The result of measurements at four contrast levels.
Reporting the results: The patient saw the 8 cpcm grating at 270 cm at full contrast, which corresponds to 38 cpd (F). The 10% contrast 4 cpcm grating was seen at 220 cm distance, which corresponds to 15 cpd (G). The 2.5% contrast 4 cpcm grating was seen at 145 cm distance, which corresponds to 10.5 cpd (H). The 1.2% contrast 0.5 cpcm grating was seen at a distance of 225 cm, which corresponds to 2.4 cpd (I). The line I-H-G-F depicts the slope of the contrast sensitivity curve.
Note that the slope is close to a straight line between full contrast and 2.5% contrast. Thus, if the subject becomes tired easily, measure the 2.5% threshold first, followed by the 1.2% threshold and first then the threshold at 10% contrast as the last measurement. The size of the grating at the different distances is 270 cm – 4 deg; 225 cm – 5.5deg; 145cm – 8.5deg.
If a child/person has several preferred retinal loci (PRL) and shifts fixation between them, you may be measuring points on two or three contrast sensitivity curves at once. This can lead to an irregular and varying form of the curve. It describes the changes in the quality of the image, which however, is usually not perceived by the person because we “edit” the image on top of the previous image combining information from all preferred loci.
The LEA Low Contrast Grating Acuity test based contrast sensitivity curve depicts the transfer function for lines at different contrast levels and spatial frequencies. It shows that the visual system is most sensitive at intermediate and low spatial frequencies.
Printable nomograms (pdf, 180 kB).
Printable recording form (pdf, 372 kB).
Printable recording form with small dots (pdf, 360 kB).
Printable recording form without dots (pdf, 316 kB).
[ Instructions I Paediatric Vision Tests I Vision Tests ]
This document was last modified on