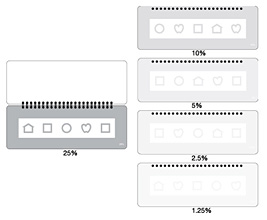
LEA SYMBOLS®
Low Contrast Test
10M Symbol Size
#251100 - #251200
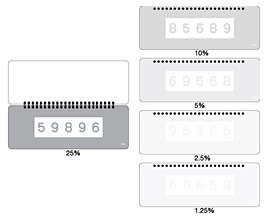
LEA NUMBERS®
Low Contrast Test
10M Number Size
#270400 - #270500
If you did not read about the introduction to contrast sensitivity measurements, we can cover some of the important facts before we discuss the tests.
Contrast is defined as luminance difference between two adjacent surfaces, i.e. if one surface reflects more light than the other surface, there is a luminance difference between them and we experience it as contrast. The LEA tests use in the definition of contrast the Michelson formula.
A person who can see faint contrasts, faint shadows, has high contrast sensitivity. A person who sees the luminance difference between two surfaces first when it is marked, has low contrast sensitivity.
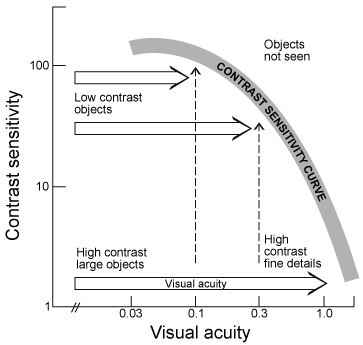
Figure 1. Contrast sensitivity curve.
Contrast sensitivity is not depicted by a single value, like visual acuity, but a curve, visuogram that depicts the types of visual information at different contrast levels the person sees: above the curve is visual information that is at too low a contrast to be seen and to the right of the curve visual information of too thin lines or small details that it cannot be seen. Within the area of the curve are low contrast information, marked “low contrast objects”but also faint shadows on a cloudy day and the faint, fast moving shadows on our faces that carry our facial expressions. On the lowest part of the curve, close to the X-axis is the high or full contrast information that we see in clean license plates, high quality printed materials and some high contrast details of buildings, art works and sometimes also in nature. The usual full contrast visual acuity value (VA) is the point on the contrast sensitivity at full contrast. Between the very low contrast area and the high contrast area is the large area of varying contrasts that we see in the environment.
The faintest contrasts that we see in Nordic countries are shadows on newly fallen dry snow on a cloudy morning. The surfaces are smooth and the light coming through the clouds does not cause dark shadows. This kind of scenery is rare and thus in the measurement of contrast sensitivity we are not interested in the lowest contrasts that can be seen, except in some occupational tasks (like finishing the surface of a white yacht) but concentrate the measurements in the contrast area where we usually function. That area is the area of the slope of the curve on its right hand side.
A straight line is defined by its end points. One of them is already measured, the point close to the X-axis, which is the visual acuity at full contrast. If we measure visual acuity at low contrast levels (the broad horizontal arrows in the Figure 1) we learn where the curve is located on the diagram and especially, we learn what the relationship is between high contrast and low contrast visual acuity values.
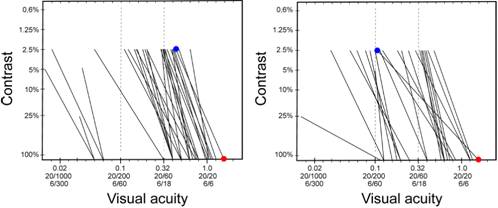
The diagram below (Figure 2) depicts slopes of contrast sensitivity curves of 50 children with different losses of vision due to brain damage (cerebral palsy, CP), the difference between these two values, full contrast VA and VA at 2.5% contrast, varies greatly. In some cases there is almost no difference, the line goes up almost vertically and in other cases the difference is more than 10 lines of visual acuity values. In the latter case there is sizable loss of low contrast functioning even if the full contrast value is a high normal value.
| A | B |
 |
|
Figure 2. Slopes of the contrast sensitivity curves of 50 school children with varying types of brain damage.
These slopes of the contrast sensitivity curve show that some children have nearly the same visual acuity value at full contrast (full contrast = about 94% contrast) and at low contrast (at 2.5% contrast). In groups of visually impaired children, like the group in Figure 2, the mean value of low contrast visual acuity values is slightly less than half of the full contrast visual acuity value. Variation in groups of adult people with impaired vision is also close to 50%. The variation in both groups is between <10% and > 70%. Therefore it is not possible to estimate what the low contrast value might be. It has to be measured. A good example is in the above picture: the two highest full contrast values in the above picture are 1.63 (20/12, 6/4). In the Figure 2.A. the corresponding low contrast value is 0.5 (20/40, 6/12) (~30% of the full contrast VA value), in the Figure 2.B. the value is close to 0.1 (20/200) (6% of the full contrast value).
As you can see in the Figure 2, the slopes of the visuogram show the variation on children’s vision very clearly, much more clearly than if you read only the visual acuity values at full contrast and 2.5% contrast level.
#251100-251200
#270400-270500
Figure 3. The surface of the low contrast charts is easily damaged. Avoid touching the white test surface. If a person needs to point with his finger at the optotype to fixate on it, use tube gauze to cover the finger.
LEA SYMBOLS® and LEA NUMBERS® LOW Contrast Test 10M
The contrast levels of the test lines on the five pages are 25%, 10%, 5%, 2.5% and 1.2%.
Visual acuity values can be measured with tests where there is only one size of optotypes. These tests have been common in measurement of low contrast sensitivity: Pelli-Robson test, Mars test and LEA Low Contrast 10M test. The 10M size was chosen because in the decimal system the visual acuity values are easy to calculate based on 10M: they are the 1/10th of the metric test distance, i.e. at 1 m the VA value is 0.1, at 2 m 0.2, and at 0.4 m 0.04. For the measurement you need a metric tape measure on the floor. This test requires walking, which sometimes seems to be a difficult activity. This test is, however, the only test that you can use in places where you cannot use the lightbox by combining this test with the screening VA test (#259900) or the usual VA charts (#250100 or #250200). During testing the test has to be kept vertical to have a constant luminance level. The luminance level is the same as on the vertical surfaces of the full contrast tests. If the upper edge of the 10M test is tilted backwards, luminance level increases and the optotypes are easier to see. So do not tilt the test.
The Snellen fractions corresponding different decimal visual acuity values are found on the list.
If you have measured VA at full contrast as a fraction, you can find the corresponding decimal value on the list. Based on the decimal acuity value you know the distance where you can start measuring; and when you have come to the threshold distance, you see the distance on the metric tape measure, write it down and then find on the list the VA value as a fraction.
1st example:
Knowing what the just measured full contrast visual acuity is, for example 0.8 (20/25, 6/9), we can expect that the low contrast value at 2.5% contrast will be somewhere between 0.25 and 0.5. Therefore we go to 5 m distance from the child/adult (if the child’s visual sphere is so large) and start from the 25% page asking “what is the first LEA Symbol or Number?”. If it is seen with ease we show the 10 % page and then the 5% page where the child may correctly recognize three optotypes. We continue to the 2.5% page and ask the child/adult to read the whole line. If only 2 optotypes are seen, we move a few centimeters closer to the child/adult to a distance of for example 3.2 m and find that now 4 optotypes are seen. The visual acuity value at 2.5% contrast is thus 0.32 -1 (equal to 20/60 -1, 6/18 -1).
During this measurement we tried to find the threshold(s) and thus moved so slowly that we did not come to a distance where all optotypes would have been seen. If that happens at the 2.5% page, we need to use the 1.2% page and move slowly closer to the child/adult hoping that only 3 or 4 optotypes are correctly recognized. When the tester has measured a few threshold values, the test requires very little time. It is also possible to measure at the 2.5% level a second time after a while. Knowing the distance where all optotypes were seen on the 2.5% page we start at a slightly longer distance.
2nd example:
If the child’s visual acuity at full contrast is 0.32 (20/63, 6/18) and the person’s contrast sensitivity seems to be low (typical difficulties in low contrast environments), we start at 3.2 m distance and may find that the child sees all but one of the symbols on the 25% contrast page (VA 0.32 -1); on the 10% page 3 symbols correctly (VA 0.32 -2), and nothing on the 5% page. Moving the test slowly to 2.5 m distance the child sees 4 optotypes correctly on the 5% page (VA 0.25-1). Moving slowly to 1.6 m distance the child sees 3 symbols (VA 0.16 -2) correctly at 2.5% contrast and nothing on the 1.2% page. At 0.8 m distance 4 symbols on the 1.2% page (VA 0.08 -1). Thus walking slowly from 3.2 m to 1.25 m distance we have measured a threshold value on each page of the 5-page test and have a well-defined CS-curve:
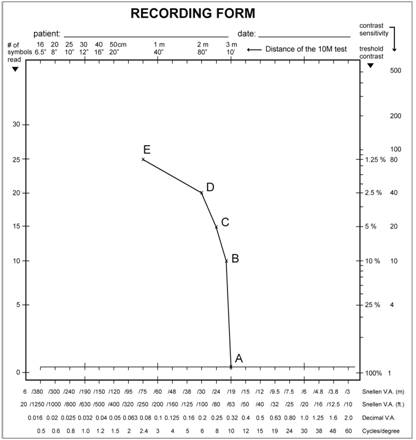
Figure 4.When drawing the curve of the above case we can use the decimal values and at the same time see the corresponding visual acuity value as a Snellen fraction. The line between point A and point D is not a perfectly straight line but the error using a straight line between them is small. We could have measured only full contrast VA value, VA value at 2.5% contrast, and at 1.25% contrast.
Most often you only need to use the 2.5% page and move so slowly that you get the threshold value. This is because the slope is close to a straight line and the values at 25%, 10%, and 5% are close to that line.
When a new test page is presented, the child/adult may say "there is nothing on that page.” It is difficult to focus on optotypes close to the threshold values. Therefore, tell the child/adult to look at the optotypes on the previous page and not to move the gaze while the page is turned. Quite often a child/person can see the whole line that he did not perceive when the image was not in perfect focus on his retina.
This 10M test must be used in this mobile way to measure thresholds at different distances, i.e at different VA values, not only at one value like when using the Pelli-Robson test. Measurements at two fixed distances may lead to a conclusion that “With the LEA SYMBOLS® at 28 cm and 1 m all children showed a floor effect; that is, most children of all ages correctly responded to the lowest contrast. LEA chart cannot measure a true contrast threshold for children with normal vision because of the floor effect.” (Leat and Wegman, 2004). At those distances the visual acuities are 0.028 (20/800, 6/240 ) and 0.1 (20/200, 6/60) i.e. not acuities of normally sighted children. The distances have been chosen incorrectly.
Since the mean visual acuity value of normally sighted children is close to 1.25 (20/16, 6/4.8) and ranges from 0.8 to 2.0, the VA value at 2.5% contrast would vary between 0.8 (20/25, 6/9) and 0.4 (20/50, 6/15). These would be “true contrast thresholds” at 2.5% contrast, not at the very low visual acuity values.as with Pelli- Robson test. The 10M tests were not designed to measure abstract low contrast VA values that do not occur in children’s life.
Reference:
SUSAN J. LEAT, PhD, FCOptom, FAAO and Daniela Wegmann, Dipl Ing (FH). Clinical Testing of Contrast Sensitivity in Children: Age-related Norms and Validity. OPTOMETRY AND VISION SCIENCE. 2004, 81(4): 245–254.
The Pelli-Robson and the Mars test measure only at a low visual acuity value (the broad vertical arrow in Figure 5).
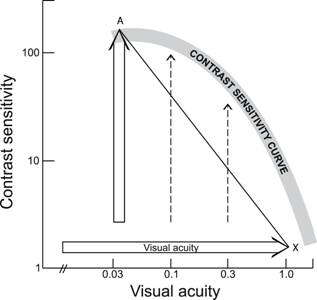
Figure 5. Principle of measurements when only one size of optotypes is used. If one measurement distance is used (Pelli-Robson and Mars test), only one low contrast threshold is defined (point A). The line A-X between the point A and the full contrast visual acuity value X is a straight line, not a curve. If several measurement distances are used (dashed vertical lines) as when using the mobile way of using the LEA 10M test, the slope and curve are defined.
If Pelli-Robson and Mars test were used at varying distances, the CS curve would be defined. Pelli-Robson test requires that the patient walks, a tester using the Mars test can walk with the test. Pelli-Robson test requires a certain place where luminance level on the test does not vary. It cannot be brought to the school or Kindergarten, whereas the Mars test and the 10M tests can.
Figure 6. The number of correct answers is read on the left vertical axis and the cross is placed corresponding to the distance used when testing. In this case the result would then be 18 correct at 3 m (marked M) and 23 correct at 1.6 m (marked S). Line S-M-X depicts the slope of the contrast sensitivity curve.
The result can be marked on the diagram by locating the test distance on the upper border of the recording form (top scale) and marking the results (in this case 18 and 23) at the point where the line of the test distance (3 m and 1.6 m) and the line of the number of the correct answers cross each other. These points are marked with S and M in the diagram.
In the diagram, it is easy to calculate that the result can also be written as VA at 2.5%: 0.3(-2) and at 1.2% contrast 0.16 (-2) (0.16 = 3/19 or 10/63).
After having used the test for a while, you will not need the recording form any more, except for reporting your results to somebody who is not accustomed to using the test. You will have a mental image about where the threshold is located on the form. You will mark down the name of the test, the number of the correct answers and the distance at which you measured or the visual acuity and the contrast level. These two numbers carry the necessary information for follow-up.
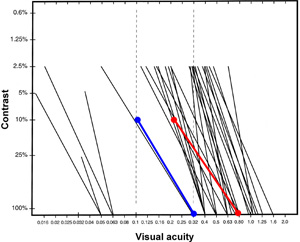
Figure 7. When both optotype and grating measurements are made, it is interesting to mark them on the recording form to see the relationship between the different threshold values. The luminance of the tests needs to be kept closely equal, otherwise the results are not comparable. In this diagram there are contrast sensitivity slopes of children with Cerebral Palsy (Figure 2). The slope of the curve based on LEA SYMBOLS® charts (blue line) and the slope based on the measurements with the LEA Grating Acuity Test and the LEA Low Contrast Grating Acuity test (red line) of a student with tetraplegic condition are placed on the background of other students’ results to demonstrate that the values measured with the large grating tests (stimulus varying between 4 degrees to 20 degrees in diameter as a function of the test distance) usually are several steps better on a logarithmic scale than values measured with optotype tests. The black slopes are based on measurements with optotype tests. There are children with brain damege whose grating acuity values are lower than their optotype acuity values at all contrast levels.
This contrast sensitivity recording form can be used to record any test results from contrast sensitivity tests. The comparison of test results from different tests is easy when they are plotted on this form. By combining results from optotype tests and grating tests the quality of the central visual field can be evaluated for low vision or occupational assessment.
In order to record the shape of the curve, it is good to get at least three measures. One measure is at the highest contrast - the typical visual acuity threshold measure and the other two at lower contrast levels. In clinical measurements it is often acceptable to measure only one measurement at 2.5% contrast to shorten the test time. If the person does not perceive the test at 2.5% contrast, then 5% and higher contrast optotypes are used.
When assessing vision of children or adults with impaired vision, the measurement using VA charts should always be complemented with measurements using low contrast gratings. See Low Contrast Grating Acuity Test.